
The results presented below are based on a questionnaire distributed to participants from the GO AQS members list. The survey, conducted using Google Forms, was open from May 15th to June 15th, 2025.
PM2.5
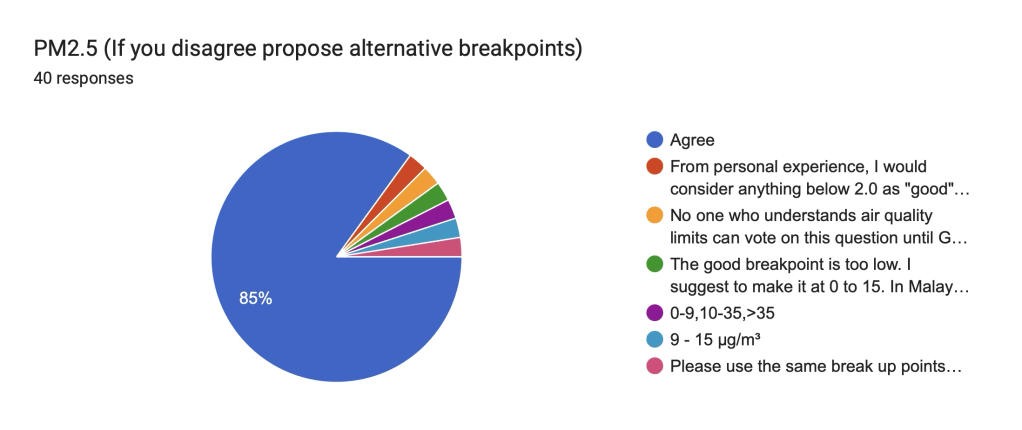
The GO IAQS Index Breakpoints Survey, with a total of 40 participants, indicated strong support for the proposed PM2.5 breakpoints, with 85% of respondents in agreement. Despite this high agreement, a general sentiment emerged that the World Health Organization’s (WHO) 5 µg/m³ limit for PM2.5 might be overly strict for continuous indoor monitoring. This concern stemmed from acknowledged limitations in common sensor accuracy (e.g., 5 µg/m³ + 5% m.v.) and the practical difficulties of consistently achieving such low levels, influenced by factors like external pollution, building ventilation systems, infiltrations, and economic constraints, particularly in diverse global contexts. Some participants suggested alternative breakpoints for PM2.5, such as considering anything below 2.0 as “good,” 2 to 10 as moderate, and above 10 as requiring immediate action, or proposing a “good” range of 0 to 15 (especially relevant in contexts like Malaysia where ambient PM2.5 is often above 5), or even broader ranges like 0-9, 10-35, and >35, or a specific range of 9 – 15 μg/m³. It was also recommended to incorporate the TAIL rating scheme, which is used for assessing indoor environmental quality in offices and hotels undergoing deep energy renovation.
Members largely supported the WHO guidelines as a crucial health-based goal for long-term protection against fine particulate matter exposure. However, there was a consistent call for clearer definitions regarding averaging intervals, with a toxicologist specifically advocating for the explicit use of 24-hour Time Weighted Averages (TWAs) as maximum ceilings for enhanced protection. Furthermore, respondents highlighted the necessity to broaden the scope beyond simple PM measurements. Strong suggestions were made to include similar breakpoint tables for Ultrafine Particles (UFPs) with specified ranges (0-10,000 #/cm3, 10,000-20,000 #/cm3, >20,000 #/cm3) and to also consider PM0.5, noting its significant harmfulness and relevance to clean room standards. Beyond physical properties like size, there was a critical emphasis on measuring and considering the chemical composition (electronegativity, hydrophobicity) of PM2.5 and UFPs, as these aspects are understood to strongly influence their toxicity and health effects.
GO AQS will study and incorporate smaller particle size limits, such as submicron and UFP, in the second version of the standard.
CO2
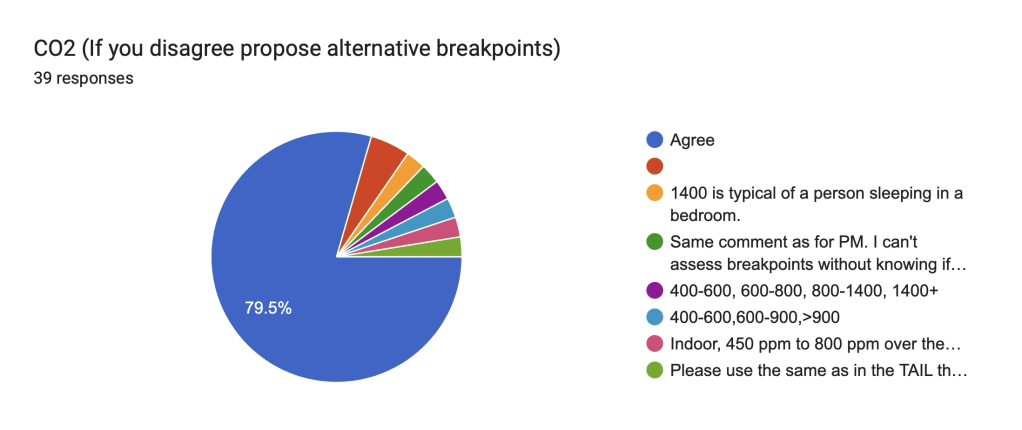
For CO2, with 39 participants, 79.5% agreed with the proposed breakpoints. However, several additional comments revealed nuanced perspectives. Some suggested refined breakpoint ranges, such as 400-600, 600-800, 800-1400, 1400+ ppm, or simpler sets like 400-600, 600-900, >900 ppm. A key concern raised was the importance of the duration at elevated CO2 concentrations over instantaneous levels, leading to a strong recommendation that all GO IAQS breakpoints for CO2 (and potentially other pollutants) should be explicitly defined as ceilings rather than Time Weighted Averages (TWAs) to ensure immediate alerts for high exposure. This aligns with existing standards like RESET/ATMO and AWAIR, which offer good ranges, and acknowledges the link between lower CO2 levels (e.g., <600 ppm) and reduced viral transmission risk, particularly in scenarios involving pandemics or immunocompromised individuals, though 800-900 ppm was also considered acceptable for general good air quality. It was also recommended to incorporate the TAIL rating scheme that follows the EN16798 Standard, which is used for assessing indoor environmental quality in offices and hotels undergoing deep energy renovation.
There was a call for clarity on whether the CO2 breakpoints refer to absolute concentrations or a delta above outdoor levels. While CO2 is acknowledged as a proxy for ventilation and an indicator of poor air exchange, some noted its limitation in accounting for mechanical filtration and advocated for stricter thresholds for the “Good” air quality band to reflect insufficient ventilation. There was also a perspective, citing ASHRAE guidance, that CO2 might not be a valid IAQ reference anymore if minimum ventilation rates (e.g., 4 l/s/occupant) are respected. Nonetheless, the consensus leaned towards acknowledging CO2’s utility as a proxy for ventilation and its role in assessing infection risk, while also considering economic feasibility for implementation across different global regions.
CO
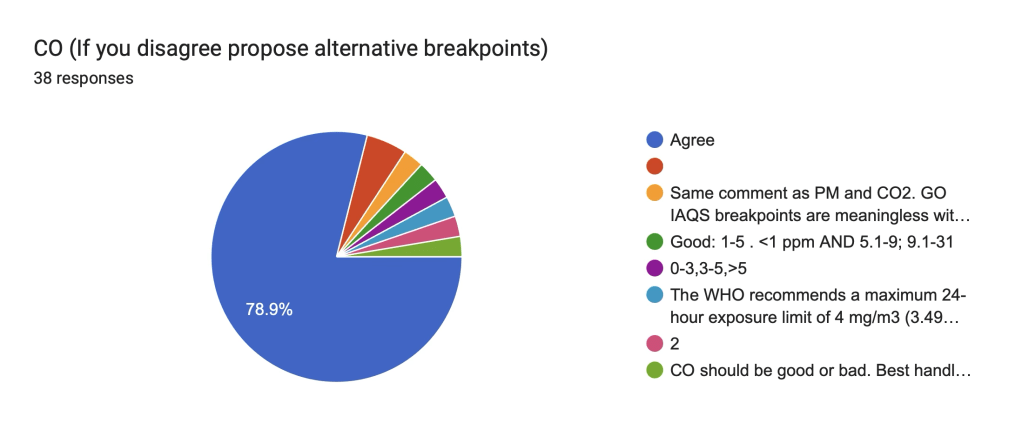
For Carbon Monoxide (CO), with 38 participants, 78.9% agreed with the proposed breakpoints. However, significant concerns and alternative suggestions were raised, particularly by a toxicologist. Key feedback emphasized that CO breakpoints, like others, are meaningless without a specified timeframe (ceiling vs. TWA). Proposed alternative ranges included 0-3, 3-5, >5 ppm, and more detailed options like Good: 1-5 ppm, <1 ppm, and 5.1-9 ppm, 9.1-31 ppm. Strong objections were raised regarding the misrepresentation of US EPA CO “breakpoints” (which are 1-hour TWA of 35ppm and 8-hour TWA of 9ppm) and the omission of the more protective WHO Air Quality Guidelines from 2021 (e.g., 24-hour TWA of 4 mg/m³ or ~3.5 ppm). Critics argued that the proposed “Good” AQI category’s upper limit of 5 ppm for CO is not sufficiently precautionary, as studies indicate increased mortality even at average CO levels above 1 ppm. There was also a debate on whether low-level CO exposure is adequately recognized for its long-term negative health impact, with some highlighting the danger of even seemingly low levels (e.g., 9 ppm potentially leading to miscarriage in pregnant individuals). The discussion also touched upon the challenges of choosing globally appropriate numbers due to varying baseline levels and endogenous CO production. However, it was noted that urban CO pollution has generally decreased, making levels above 3 ppm indicative of an anomaly that warrants investigation. References to European work safety limits (23 mg/m³=20 ppm) and UK standards (BS EN 50291‑1) were also made.
CH2O
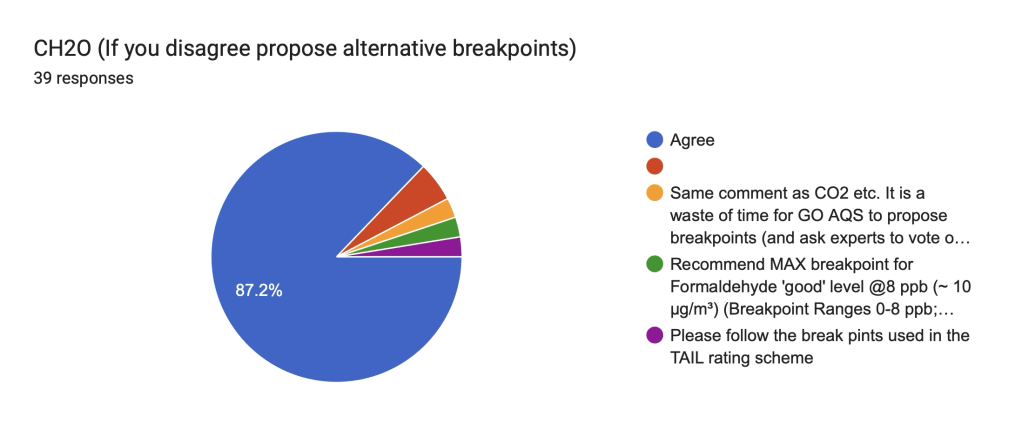
For Formaldehyde (CH2O), with 39 participants, 87.2% agreed with the proposed breakpoints. Despite this high level of agreement, several comments advocated for more stringent “Good” level breakpoints, proposing breakpoints such as 0-8 ppb (~10 µg/m³), 8.1-100 ppb, and 101-500 ppb. While the proposed breakpoints might be acceptable for Time Weighted Averages (TWAs), there was a concern that they might be too strict for continuous monitoring. A significant point raised was that adverse effects, including lung cancer, are noted above 20 ppb, leading to the argument that if GO AQS aims to protect occupant health, the acceptable maximum should be significantly lower than 50 ppb. Furthermore, a crucial reminder was provided that for gases produced endogenously by humans and other mammals (such as CH2O, CO, CO2, O3, and NO2), the optimal level of exposure is not zero, but rather a range between too little (causing deficiency symptoms) and too much (causing toxicity symptoms), unlike exogenous poisons. The more stringent breakpoints were supported by considerations such as increased building envelope tightness for energy efficiency, the needs of vulnerable populations, and alignment with stringent healthy building standards, referencing examples like California OEHHA’s Chronic Reference Exposure Level of 9 µg/m³ (~7.3 ppb) and low-emitting product standards like French VOC Emissions Class A+ and German AgBB compliance, which set limits below 10 µg/m³ after 28 days. The long-term, serious health impacts, such as cancer, associated with subtle, unperceived exposures to dangerous gases like CH2O also underscored the need for a cautious and demanding approach. It was also recommended to incorporate the TAIL rating scheme, which is used for assessing indoor environmental quality in offices and hotels undergoing deep energy renovation.
O3
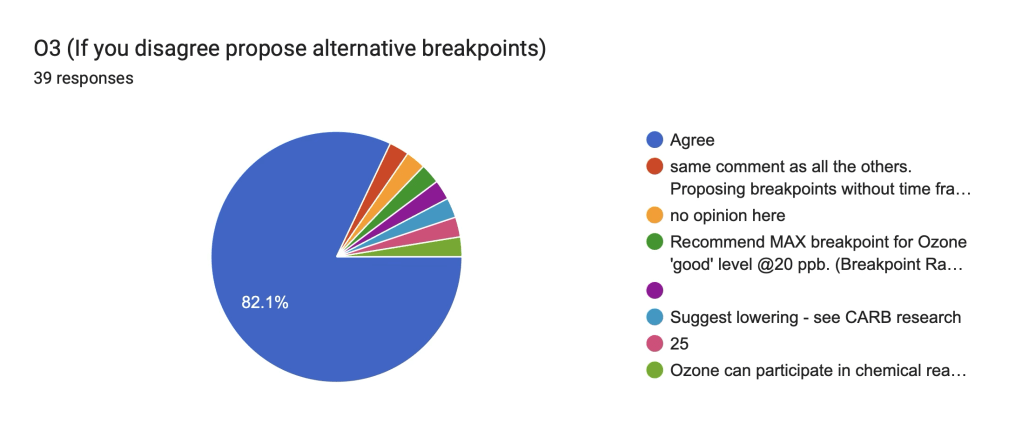
For Ozone (O3), with 39 participants, 82.1% agreed with the proposed breakpoints. However, comments suggested lowering the “Good” breakpoint, with specific recommendations for a maximum of 20 ppb (and corresponding ranges of 0-20 ppb, 20.1-80 ppb, 81-300 ppb) or an upper limit of 25 ppb, with others citing CARB research. There was strong feedback that the O3 Breakpoints Explanation should explicitly mention the WHO limits and correct any misrepresentations of US and European limits in the accompanying table, emphasizing the need for accuracy. A significant concern was raised regarding the combined effect of maximum exposure duration and the generation of secondary pollutants (e.g., ozone interacting with VOCs to create aldehydes). Participants noted that indoor ozone levels are complex and react with the outdoor environment, potentially forming more harmful byproducts, suggesting that a low indoor ozone reading might not necessarily indicate good air quality if it has reacted to form other pollutants. While acknowledging O3 as often an outdoor pollutant, its impact indoors and the importance of clear guidelines for concentrations based on environmental O3 entering through ventilation (without additional ozone or byproduct generation from air cleaning devices) were highlighted. The increasing concentration of ozone outdoors in Europe and its link to premature deaths reinforced the agreement for strict indoor breakpoints.
NO2
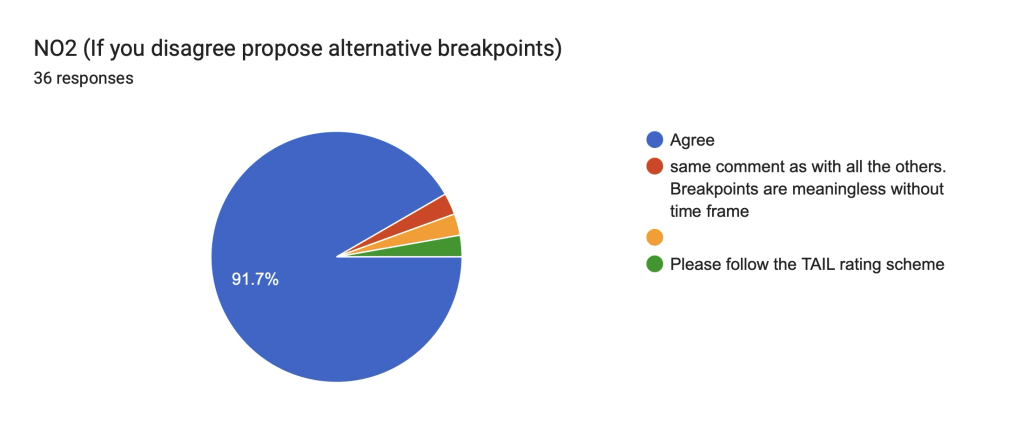
For Nitrogen Dioxide (NO2), with 36 participants, 91.7% agreed with the proposed breakpoints. However, substantial critique was provided regarding the explanation of these breakpoints. It was argued that GO AQS did not conduct “dedicated research” but rather reviewed existing studies. More importantly, concern was raised that the proposed initial breakpoint of 30 ppb, described as a “lower threshold” for a “health-protective index indoors,” is in fact less protective than several existing limits, including those from India, Europe, new Europe, and particularly the latest WHO indoor limit of 25 µg/m³ (~13 ppb). Critics questioned why GO AQS is not proposing breakpoints at least as protective as the WHO’s 2021 recommendations, suggesting that proposing higher exposures without disclosing lower WHO limits might imply an intent to hinder the adoption of these more protective, scientifically credible, and unbiased WHO standards. Concerns were also expressed about the generation of secondary pollutants through NO2 interaction with VOCs. Despite these criticisms, the overall consensus was to agree with the proposed breakpoints, with some emphasizing the importance of encompassing all indoor environments, including those with combustion sources, and fully supporting the lower limits. The decreasing concentration of NO2 outdoors and its link to reduced premature deaths in Spain was also noted, reinforcing the need for demanding standards both inside and outside buildings. It was also recommended to incorporate the TAIL rating scheme, which is used for assessing indoor environmental quality in offices and hotels undergoing deep energy renovation.
Radon
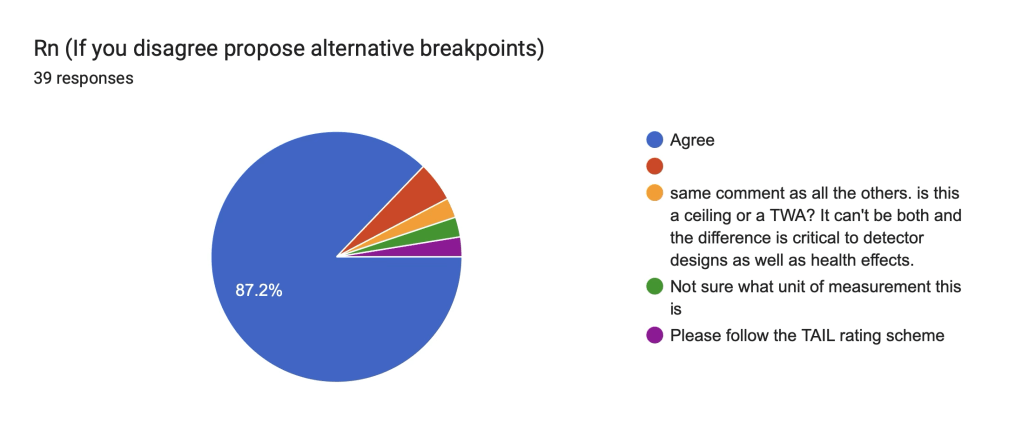
For Radon, with 39 participants, 87.2% agreed with the proposed breakpoints. However, several comments indicated a need for greater clarity and stringency. Participants highlighted that Airthings and Aranet limits, though based on WHO long-term TWAs, are often treated as ceilings, and suggested expanding the table to include specific rows for WHO and US EPA radon limits. Concerns were raised that there is no safe threshold for radon exposure, as every level carries a risk. Specific regional data, such as Germany’s classification of radon prevention regions with average cellar concentrations exceeding 300 Bq/m³ and an average indoor concentration of ~65 Bq/m³, were provided. While some agreed that keeping levels below 100 Bq/m³ is acceptable and obtainable with reasonable intervention, others advocated for stricter limits, aligning with standards like the Building Biology standard of <60 Bq/m³ for “no to slight anomaly.” The general sentiment favored adopting the most strict and effective limits for radon, acknowledging that it is a gas often unknown to a significant portion of the world and that dealing with it can involve unskilled solutions. It was also recommended to incorporate the TAIL rating scheme, which is used for assessing indoor environmental quality in offices and hotels undergoing deep energy renovation.
Conclusion
Overall, participants in the survey offered valuable insights into the practical application and scientific grounding of the proposed breakpoints. A recurring theme was the distinction between Time Weighted Averages (TWAs) and continuous monitoring, with several comments noting that while stricter TWA limits might be desirable for health protection, they could be challenging to consistently maintain for continuous monitoring in real-world indoor environments. This highlights a key benefit of the GO IAQS Index, which leverages newer technologies to understand air quality in real-time and at a lower cost, departing from past approaches that relied on averaging values from reference stations and instruments. This real-time approach allows occupants to take immediate actions, such as leaving a room, if the environment becomes critical for certain individuals, rather than waiting for hours. There was broad appreciation for the survey’s design and thorough preparation. Many advocated for the inclusion of additional pollutants, such as TVOC; regarding TVOC, GO AQS has addressed this in its white paper, explaining why current recommendations for a specific limit are not feasible at this time. There was strong agreement on the need for more stringent limits for PM2.5 and various gases to enhance public health protection, acknowledging the clear evidence of long-term health impacts from even low levels of fine particulate matter, especially on vulnerable populations. The feedback consistently highlighted the importance of a dynamic indoor air assessment and the necessity for a globally harmonized standard that considers the diverse experiences of technicians from countries facing significant air quality challenges. Emphasis was placed on ensuring that the standard serves as an accessible global reference, safeguarding human life and health irrespective of economic limitations. Lastly, participants stressed the importance of being discerning when setting thresholds for all air quality variables, given that identified problems often have readily available solutions, and called for greater clarity around daily and annual limit thresholds, as well as the evaluation of background levels.
GO IAQS Index Comparison Sheet
Next Steps
We’ve tallied the votes on Doodle.com for our video call to discuss the findings and consolidate the breakpoints. The majority of members have agreed on June Friday 20th at 3 PM CEST (invites will be sent to all members). We understand this time may be late for our colleagues in Australia and Asia. If you’d like to suggest an alternative time as a secondary meeting, please email us or leave a comment.

Leave a comment