In the evolving landscape of building health, the lack of a standardized language for Indoor Air Quality (IAQ) has often left facility managers and occupants in the dark. Recognizing this, GO AQS introduced a unified framework in late 2025 to harmonize IAQ communication. AirVoice has recently demonstrated its leadership in this space by being among the first to fully integrate the GO IAQS methodology into its product offerings, as evidenced by its latest demonstrative report (click here for the example).
By adopting the GO IAQS framework, AirVoice has transformed complex sensor data into a clear, actionable narrative. Here is how AirVoice implemented this new global standard into its product.
1. Adopting a Universal IAQ Language
The core of the GO IAQS methodology is the creation of a common language that everyone, from engineers to office workers and kids, can understand. Instead of merely displaying raw numbers, the AirVoice report categorizes air quality into three intuitive tiers:
- Good: Optimal conditions for health and productivity.
- Moderate: Levels that may require attention.
- Unhealthy: Levels that pose a risk and require immediate intervention.
2. Standardized Thresholds and Metrics
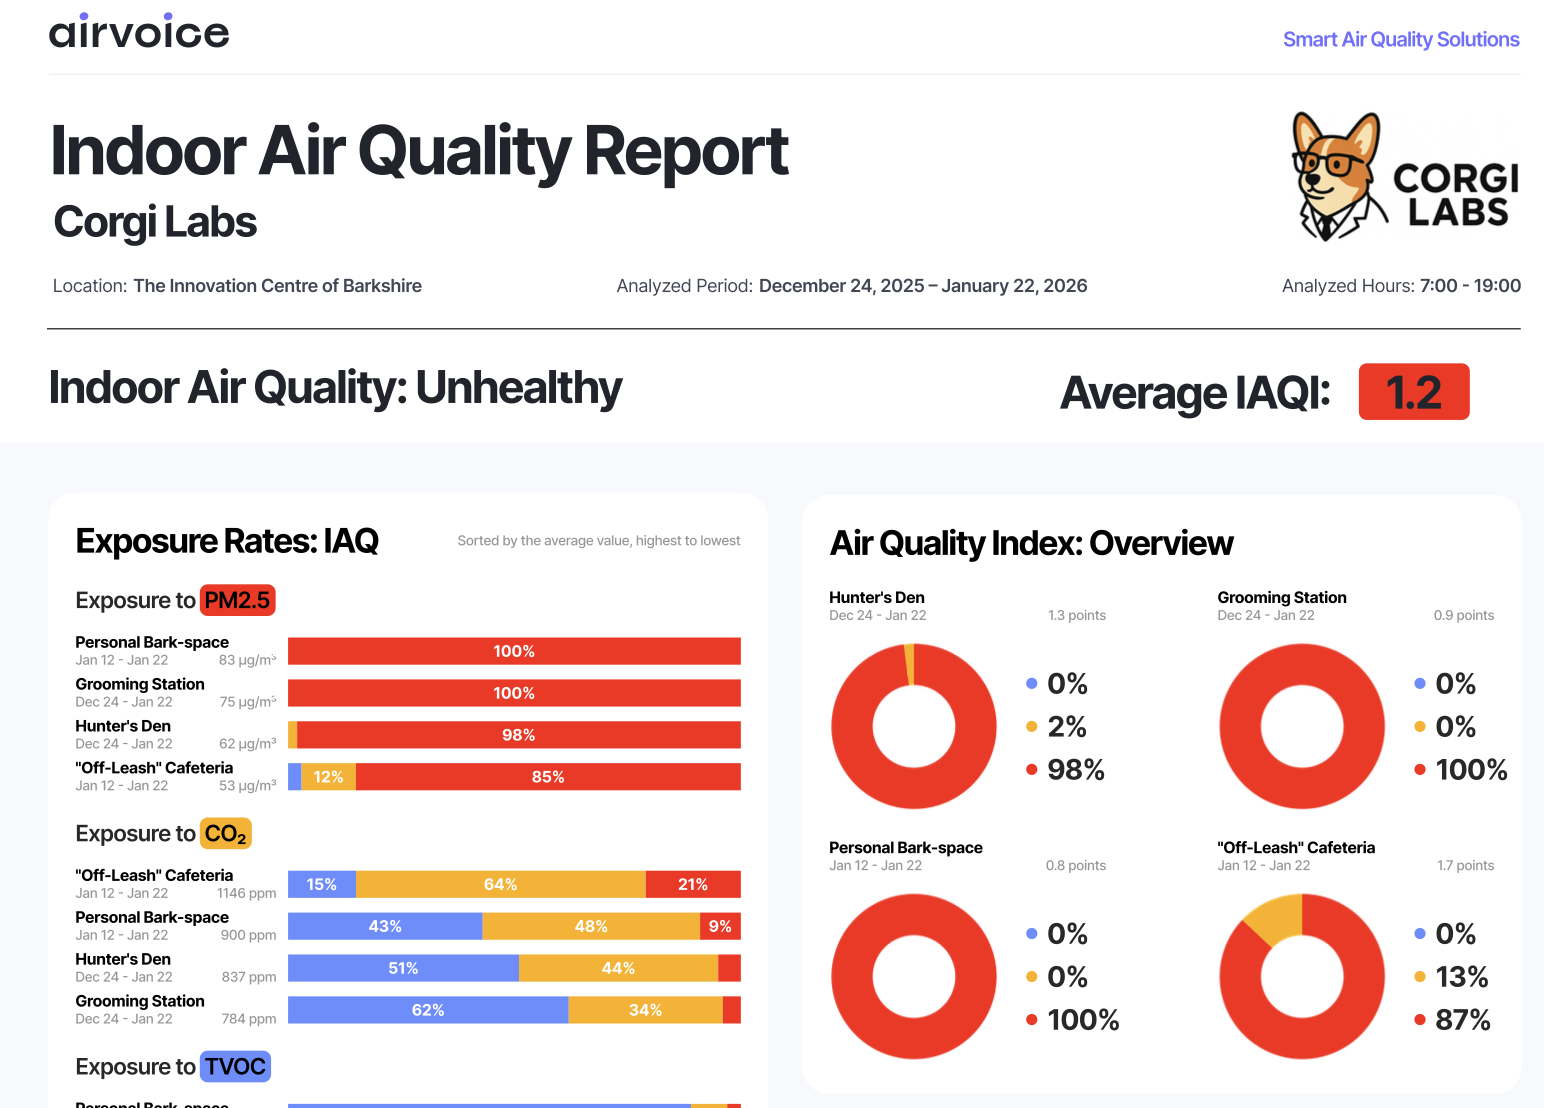
AirVoice aligned its reporting logic with the specific thresholds proposed by GO AQS for various pollutants. This ensures that “Unhealthy” means the same thing across different buildings and platforms. Key implementations include:
- PM2.5: AirVoice flags air as “Unhealthy” when concentrations exceed 25 µg/m³, while “Good” air is maintained below 10 µg/m³.
- CO₂: To gauge ventilation effectiveness, AirVoice uses our recommendation of keeping levels below 800 ppm for a “Good” rating, with anything above 1400 ppm classified as “Unhealthy”.
3. The Indoor Air Quality Index (IAQI)
AirVoice introduced a composite Indoor Air Quality Index (IAQI) based on the GO IAQS methodology. This index provides a single, easy-to-digest score from 0 to 10.
- A score above 8 points signifies “Good” air.
- A score below 4 points indicates “Unhealthy” conditions.
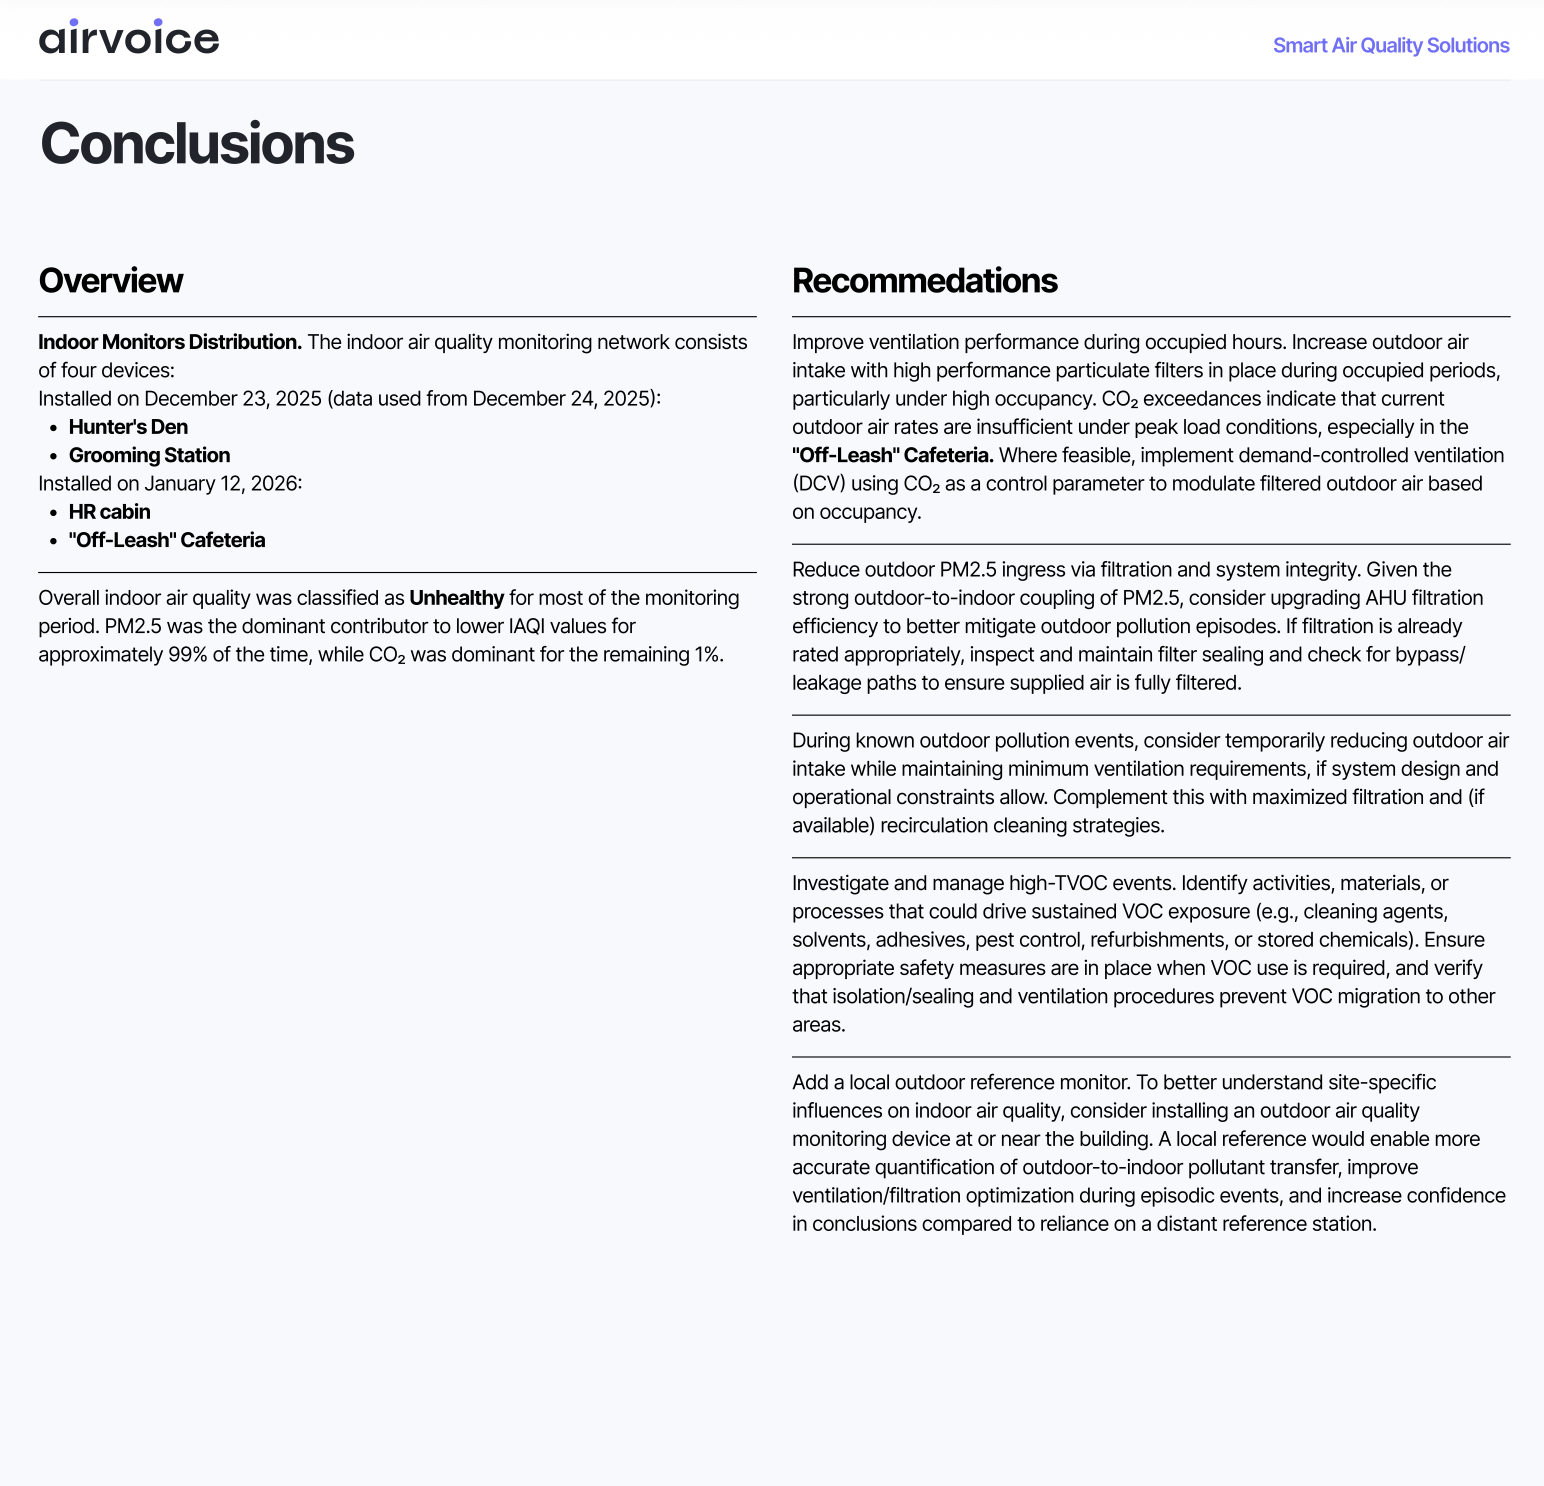
In the Corgi Labs pilot, AirVoice was able to quickly identify the environment as “Unhealthy” with an average IAQI of 1.2, primarily driven by PM2.5 levels.
4. Advanced Visualization of Dynamics
Implementation didn’t stop at numbers; AirVoice revamped its data visualization to meet GO AQS’s rigorous analysis requirements. The product now features:
- Day-to-Day Dynamics (Candle Plots): Using interquartile ranges and wicks to show daily fluctuations, minimums, and maximums without being distorted by outliers.
- Daily Cycles: Hourly profiles that illustrate how air quality changes over a “typical day,” allowing users to spot patterns related to building occupancy.
- Outdoor Reference Integration: Every chart includes a blue “Outdoor Reference Line,” helping users determine if indoor pollution is locally generated or leaking in from the outside.
5. From Data to Recommendations
Finally, AirVoice utilized the GO AQS framework to provide evidence-based recommendations. Because the data is categorized according to global standards, the system can automatically suggest specific mitigations, such as upgrading AHU filtration if indoor PM2.5 trends follow outdoor patterns, or implementing demand-controlled ventilation (DCV) if CO₂ levels exceed 1400 ppm during peak hours.
Conclusion
By implementing the GO AQS methodology, AirVoice is doing more than just selling sensors; they are providing a standardized “health score” for the built environment. This alignment ensures that IAQ data is no longer siloed or subjective, but part of a global effort to improve the air we breathe indoors.

Leave a comment